← The United Kingdomchartlink · choropleth
The United Kingdom by: local authorities · constituencies · nations · regions
Map of the United Kingdom by local authority, one number per council area, with the region borders
Also: UK local authority map · map of Britain by council area · local authority district choropleth · map of England, Scotland, Wales and Northern Ireland by council · LAD map
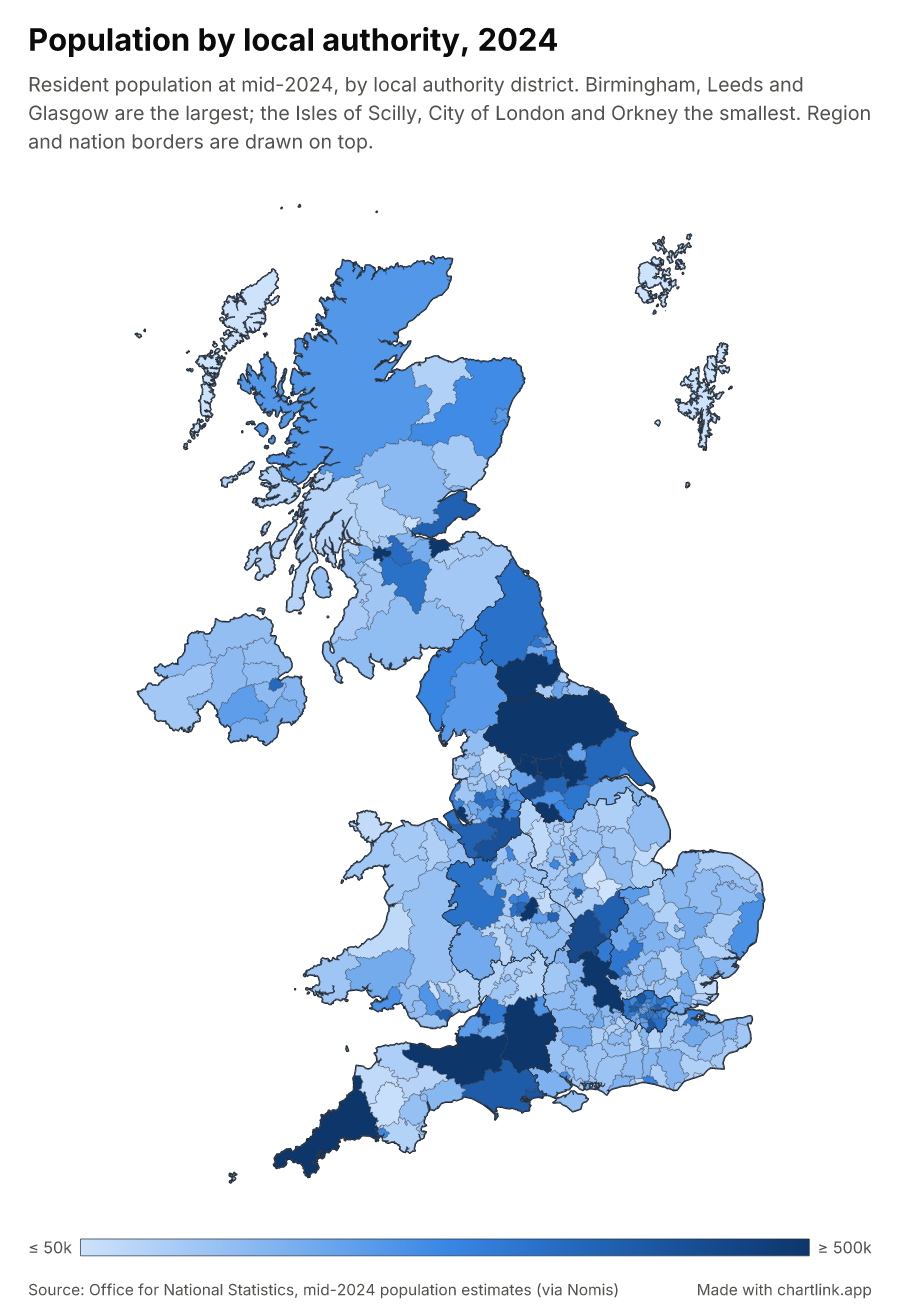
Example: Population by local authority, 2024 — Resident population at mid-2024, by local authority district. Birmingham, Leeds and Glasgow are the largest; the Isles of Scilly, City of London and Orkney the smallest. Region and nation borders are drawn on top.
About this template
Data: one row per local authority district (361 across the UK: English districts and unitaries, Scottish council areas, Welsh principal areas, Northern Irish districts) with its ONS GSS code (E06000001 for Hartlepool, S12000033 for Aberdeen City) or its name, and a number. A district with no row stays grey. The region and nation borders are drawn on top so the districts read inside them. Orkney and Shetland are drawn east of the mainland, at their own scale. Same design as the nation, region and constituency maps.
A choropleth map of the regions of the "uk-local-authorities" geography, each region filled by one number from your data (the "population" column). The borders of UK's regions are drawn on top of the regions in dark navy blue, 0.5 units wide, so the finer regions read inside their larger units.
A sequential colour scale from pale blue for the smallest values to deep navy blue for the largest; pinned to 50000 to 500000, so values beyond the ends take the end colour and the colour bar says ≤ and ≥; a gradient colour bar below the map, with its labels underneath; values formatted in compact form (1.2k, 3.4M), 1 decimal; on a white canvas (#ffffff) with near-black text — a light theme; 0.25-unit hairline outlines between regions.
The title and description are left-aligned above the chart. Font: Inter (the default); a source line with a link sits at the bottom, with the chartlink badge in the corner.
Data: 2 columns — authority (string, "Local authority (ONS code or name)"), population (number, "Population, mid-2024 estimate") — and 361 rows in the example "Population by local authority, 2024". Regions are named by ISO 3166-2 region codes or region names; a region with no row stays unfilled in grey, and an unknown code fails loudly with the nearest matches. Your data keeps the same column ids and every other setting comes from the template; an agent can change any of them.
Other looks of this template — dark (on a dark canvas): ast_PLKN1j9F2ayIwg7dbLkkP; buckets (with the values in classes and a swatch legend): ast_8HtU2m0hFeWEy1TwYRwkQ; editorial (in the editorial house style — serif type on paper, a green ramp): ast_EN6ezKsiNH0T5XsmjEbDn; categories (with a text category per region and a swatch legend): ast_JmLUoD2bWAVHJJsX8sTDb; buckets-dark (with the values in classes and a swatch legend, on a dark canvas): ast_b2rlP9NB4q6r2AyN0LJQn; surroundings (with the land around the place drawn in grey): ast_ISQopUq9LcW07SBvmBMC3; categories-dark (with a text category per region and a swatch legend, on a dark canvas): ast_cht1fHFgrfyZxKaxoi0gv; buckets-editorial (with the values in classes and a swatch legend, in the editorial house style — serif type on paper, a green ramp): ast_1MkwV6sIpwPwHiIprMwP3; dark-surroundings (on a dark canvas, with the land around the place drawn in grey): ast_HaudVkdG8Oh1K8g1r2wTw; buckets-surroundings (with the values in classes and a swatch legend, with the land around the place drawn in grey): ast_aqTMHbqOEvPsOFoqgMXlL; categories-editorial (with a text category per region and a swatch legend, in the editorial house style — serif type on paper, a green ramp): ast_fsuBWzkLaBifs1xBPFecZ; editorial-surroundings (in the editorial house style — serif type on paper, a green ramp, with the land around the place drawn in grey): ast_FY4WEpmGzeGk7f4KcDN2I; categories-surroundings (with a text category per region and a swatch legend, with the land around the place drawn in grey): ast_ELcY9bAXK71UjyBxtTlJY; buckets-dark-surroundings (with the values in classes and a swatch legend, on a dark canvas, with the land around the place drawn in grey): ast_cF1bgDjG1AZTV6EYMMAsS; categories-dark-surroundings (with a text category per region and a swatch legend, on a dark canvas, with the land around the place drawn in grey): ast_8BXXyMq9STZ5JL4wIJyJh; buckets-editorial-surroundings (with the values in classes and a swatch legend, in the editorial house style — serif type on paper, a green ramp, with the land around the place drawn in grey): ast_HxVbMzlMkbXJjo8hHplwL; categories-editorial-surroundings (with a text category per region and a swatch legend, in the editorial house style — serif type on paper, a green ramp, with the land around the place drawn in grey): ast_WF6P56wQWeyb8jCziJAY6. On the page, switch with the toggles; an agent passes that id as the template instead.
Use it with your agent
Copy the prompt, paste it into Claude, ChatGPT, Cursor or any agent with the chartlink MCP server or API, and give it your numbers. It rebuilds this exact design with your data and hands back an embed, a PNG and a page.
The prompt in full
Data this template expects
| column id | type | in the example |
|---|---|---|
| authority | string | Local authority (ONS code or name) |
| population | number | Population, mid-2024 estimate |
361 rows in the example. Your data keeps these column ids; everything else about the chart comes from the template.
For agents: the API call
POST https://chartlink.app/api/assets
{
  "template": "ast_nwMOrBIZCW0GTFOSF6SwI",
  "knobs": {
    "theme": "light",
    "dataType": "gradient",
    "title": {
      "text": "Your title"
    },
    "source": {
      "text": "Where the numbers come from"
    }
  },
  "data": {
    "columns": [
      {
        "id": "authority",
        "type": "string"
      },
      {
        "id": "population",
        "type": "number"
      }
    ],
    "rows": [
      [
        "…"
      ]
    ]
  },
  "publish": true
}
The recipe (the template's settings)
{
  "chart": {
    "domain": [
      50000,
      500000
    ],
    "format": {
      "kind": "number",
      "compact": true,
      "decimals": 1
    },
    "borders": {
      "color": "#1f2937",
      "width": 0.5,
      "geography": "uk-regions"
    },
    "outline": {
      "width": 0.25
    },
    "geography": "uk-local-authorities"
  },
  "title": {
    "text": "Population by local authority, 2024"
  },
  "preset": "map-light",
  "source": {
    "url": "https://www.nomisweb.co.uk/datasets/pestsyoala",
    "text": "Office for National Statistics, mid-2024 population estimates (via Nomis)"
  },
  "encoding": {
    "value": {
      "column": "population"
    },
    "region": {
      "column": "authority"
    }
  },
  "description": {
    "text": "Resident population at mid-2024, by local authority district. Birmingham, Leeds and Glasgow are the largest; the Isles of Scilly, City of London and Orkney the smallest. Region and nation borders are drawn on top."
  }
}
map · choropleth · united-kingdom · local-authorities · uk-set
Similar templates
- Map of the United Kingdom by parliamentary constituency, one number per seat, with the nation borders
- Map of the United Kingdom by region, one number per region
- Map of the United Kingdom by nation, one number per nation
- Map of Europe by NUTS 3 region, one number per region
- Map of Europe by NUTS 2 region, one number per region
- Map of Europe by NUTS 1 region, one number per region
- Map of Europe by country, one number per country
- Map of Slovakia by municipality, one number per municipality
- All templates →