← Brazilchartlink · choropleth
Brazil by: immediate regions · intermediate regions · states
Map of Brazil by immediate geographic region, one number per region
Also: Brazil map by immediate region · mapa do Brasil por região imediata · regiões geográficas imediatas · Brazil detailed regional choropleth · map of Brazil's 510 immediate regions with the state borders
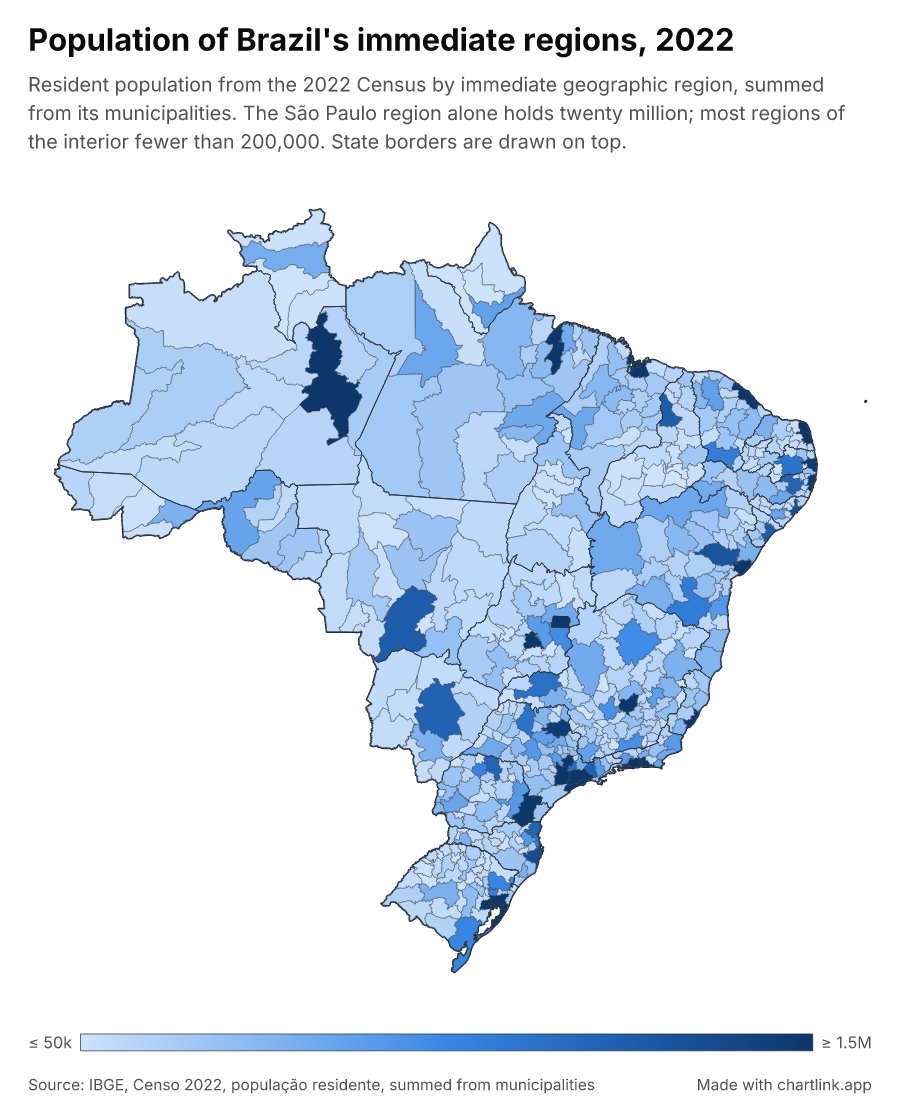
Example: Population of Brazil's immediate regions, 2022 — Resident population from the 2022 Census by immediate geographic region, summed from its municipalities. The São Paulo region alone holds twenty million; most regions of the interior fewer than 200,000. State borders are drawn on top.
About this template
Data: one row per immediate geographic region with its IBGE code (350001 for São Paulo, 330001 for Rio de Janeiro) or its name, and a number. A region with no row stays grey. IBGE's 510 regiões geográficas imediatas group the municipalities around the town they depend on for work, shopping and services; they are the finest level below the states that a whole-country map can still read. State borders are drawn on top. Same design as the other country maps.
A choropleth map of the regions of the "br-immediate-regions" geography, each region filled by one number from your data (the "population" column). The borders of Brazil's regions are drawn on top of the regions in dark navy blue, 0.5 units wide, so the finer regions read inside their larger units. The view is cropped to longitude -75–-32.3 and latitude -33.8–6.3.
A sequential colour scale from pale blue for the smallest values to deep navy blue for the largest; pinned to 50000 to 1500000, so values beyond the ends take the end colour and the colour bar says ≤ and ≥; a gradient colour bar below the map, with its labels underneath; values formatted in compact form (1.2k, 3.4M), 1 decimal; on a white canvas (#ffffff) with near-black text — a light theme; 0.3-unit hairline outlines between regions.
The title and description are left-aligned above the chart. Font: Inter (the default); a source line with a link sits at the bottom, with the chartlink badge in the corner.
Data: 2 columns — region (string, "Immediate region (IBGE code or name)"), population (number, "Population, Census 2022") — and 510 rows in the example "Population of Brazil's immediate regions, 2022". Regions are named by ISO 3166-2 region codes or region names; a region with no row stays unfilled in grey, and an unknown code fails loudly with the nearest matches. Your data keeps the same column ids and every other setting comes from the template; an agent can change any of them.
Other looks of this template — dark (on a dark canvas): ast_IaRqCMrc6iS75JOALzvmh; buckets (with the values in classes and a swatch legend): ast_df9AZUkZp4zGW56zlWr3z; editorial (in the editorial house style — serif type on paper, a green ramp): ast_P7MbRX7ClD3iGAeEK1yw7; categories (with a text category per region and a swatch legend): ast_gmWmdAuji3jbhOkwqCnUL; buckets-dark (with the values in classes and a swatch legend, on a dark canvas): ast_gGn7dLCvyLuWPqwFqnVzc; surroundings (with the land around the place drawn in grey): ast_urNcyK5SK5qLWkahaWZ14; categories-dark (with a text category per region and a swatch legend, on a dark canvas): ast_AySv9jW2CfMp8ablTbv6s; buckets-editorial (with the values in classes and a swatch legend, in the editorial house style — serif type on paper, a green ramp): ast_8qrtvHwP3aVaOpSVzLvKi; dark-surroundings (on a dark canvas, with the land around the place drawn in grey): ast_pFLaTlyIxpT8KgAWxybnG; buckets-surroundings (with the values in classes and a swatch legend, with the land around the place drawn in grey): ast_uNy5QOmEyJ2YKNQ2HJbOm; categories-editorial (with a text category per region and a swatch legend, in the editorial house style — serif type on paper, a green ramp): ast_cJ9GCsTcvlttlAJpSYByy; editorial-surroundings (in the editorial house style — serif type on paper, a green ramp, with the land around the place drawn in grey): ast_B0VQIjsXn7L5bX3kKzZYa; categories-surroundings (with a text category per region and a swatch legend, with the land around the place drawn in grey): ast_m4xJq6W7hwJsti86JHFMK; buckets-dark-surroundings (with the values in classes and a swatch legend, on a dark canvas, with the land around the place drawn in grey): ast_6L8UR3P2DGg0p7rRAqAtZ; categories-dark-surroundings (with a text category per region and a swatch legend, on a dark canvas, with the land around the place drawn in grey): ast_lzSzXIxZ9xA38wb3QjwwJ; buckets-editorial-surroundings (with the values in classes and a swatch legend, in the editorial house style — serif type on paper, a green ramp, with the land around the place drawn in grey): ast_UO0eCHC31mh4gUA28zMo9; categories-editorial-surroundings (with a text category per region and a swatch legend, in the editorial house style — serif type on paper, a green ramp, with the land around the place drawn in grey): ast_KqanUkujgxV5G83mk1jT6. On the page, switch with the toggles; an agent passes that id as the template instead.
Use it with your agent
Copy the prompt, paste it into Claude, ChatGPT, Cursor or any agent with the chartlink MCP server or API, and give it your numbers. It rebuilds this exact design with your data and hands back an embed, a PNG and a page.
The prompt in full
Data this template expects
| column id | type | in the example |
|---|---|---|
| region | string | Immediate region (IBGE code or name) |
| population | number | Population, Census 2022 |
510 rows in the example. Your data keeps these column ids; everything else about the chart comes from the template.
For agents: the API call
POST https://chartlink.app/api/assets
{
  "template": "ast_XoyGWpcUUceZQEpTzRIZd",
  "knobs": {
    "theme": "light",
    "dataType": "gradient",
    "title": {
      "text": "Your title"
    },
    "source": {
      "text": "Where the numbers come from"
    }
  },
  "data": {
    "columns": [
      {
        "id": "region",
        "type": "string"
      },
      {
        "id": "population",
        "type": "number"
      }
    ],
    "rows": [
      [
        "…"
      ]
    ]
  },
  "publish": true
}
The recipe (the template's settings)
{
  "chart": {
    "bounds": [
      -75,
      -33.8,
      -32.3,
      6.3
    ],
    "domain": [
      50000,
      1500000
    ],
    "format": {
      "kind": "number",
      "compact": true,
      "decimals": 1
    },
    "borders": {
      "color": "#1f2937",
      "width": 0.5,
      "geography": "br-regions"
    },
    "outline": {
      "width": 0.3
    },
    "geography": "br-immediate-regions"
  },
  "title": {
    "text": "Population of Brazil's immediate regions, 2022"
  },
  "preset": "map-light",
  "source": {
    "url": "https://sidra.ibge.gov.br/tabela/4714",
    "text": "IBGE, Censo 2022, população residente, summed from municipalities"
  },
  "encoding": {
    "value": {
      "column": "population"
    },
    "region": {
      "column": "region"
    }
  },
  "description": {
    "text": "Resident population from the 2022 Census by immediate geographic region, summed from its municipalities. The São Paulo region alone holds twenty million; most regions of the interior fewer than 200,000. State borders are drawn on top."
  }
}
map · choropleth · brazil · immediate-regions · regions · country-regions
Similar templates
- Map of Brazil by intermediate geographic region, one number per region
- Map of Italy by region, one number per region
- Map of Brazil by state, one number per state
- Map of Australia by SA4 statistical region, one number per region
- Map of Slovakia by region, one number per region
- Map of Greece by region, one number per region
- Map of Ireland by region, one number per region
- Map of Finland by region, one number per region
- All templates →